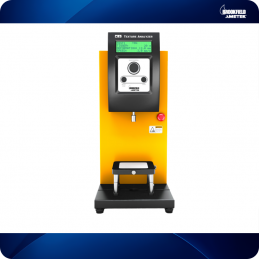
Lasagna breaking strength measurement

PRINCIPLE OF THE TEST
Evaluate the tensile strength of dry lasagna using a three point folding attachment (TA-TPB).
CONTEXT
The hanging characteristics of dry lasagna can be determined using the three-point elbow assembly.
The sample is supported at two points by the adjustable brackets which are equidistant from each other at a distance that will support the sample.
The flexion probe is connected to the probe rod of the instrument and the lasagna sheet rests on the two adjustable brackets. As the probe descends at a given test rate, a force is applied to the surface of the sample until the sample snaps along its width, creating a single fracture at the point of contact with the probe. .
The three-point bend test can be used to improve production consistency to maintain an "ideal" texture. The parameters of interest are the hardness, fracturing / brittleness and strain of the first fracture. Fracturing is the force required to generate the first fracture and the first fracture strain is the distance to the point of failure. This value gives an indication of the flexibility of the sample.
The brittleness (fracturability) measurements of the test reflect the fracture characteristics of the sample and can be used to optimize product formulation (e.g., moisture content, mixing time, temperature, gluten strength) and handling during manufacture.
The amount of fractures measured from the test can be used to establish a sensory preference for the product during product development.
Depending on the texture of the lasagna, the fracturing value may be the same as the hardness value if the sample only fractures once when breaking. Collectively, the fracturing, hardness, and amount of fracture measured in the test will give a good indication of the effects of formulation changes and process control.
METHOD
Equipment:
Instruments: CTX with 5Kg load cell
Accessory: TA-BT-KIT Luminaire base table
TA-TPB 3-point elbow assembly
Software: Texture Pro software
Settings :
Type of test: Compression
Pre-test speed: 2.0 mm / s
Test speed: 3.0 mm / s
Post-test speed: 3.0 mm / s
Target type: Distance
Target value: 5.0 mm
Trigger force: 15 grams
SAMPLE PREPARATION
Remove the sample from the storage area just before testing. Avoid exposing the sample to moisture.
PROCEDURE
Attach the flexion probe to the probe rod of the instrument.
Place the fixture base table on the instrument base and lightly tighten the wing nuts to allow some degree of mobility.
Insert the three-point elbow assembly onto the fixture base table and tighten in position using the thumbscrews.
Using the graduated marks on the bracket, adjust the two adjustable brackets so that they are of equal length to each other. The chosen distance must be able to support the sample.
Lower the instrument arm a few millimeters above the base of the brackets and center-align the two brackets on the flexion probe above by repositioning the base table of the device until the flexion probe or at an equal distance from the two supports.
When alignment is complete, tighten the wing nuts on the fixture base table to prevent further movement.
Lift the instrument arm to leave room to place the sample.
Remove the sample from storage and place it centrally on the racks.
The starting position of the instrument support arm is optional. It is best to have the probe in close proximity to the sample surface in order to speed up the test. The flexion probe should not, however, touch the surface of the sample.
Start the test.
RESULTS
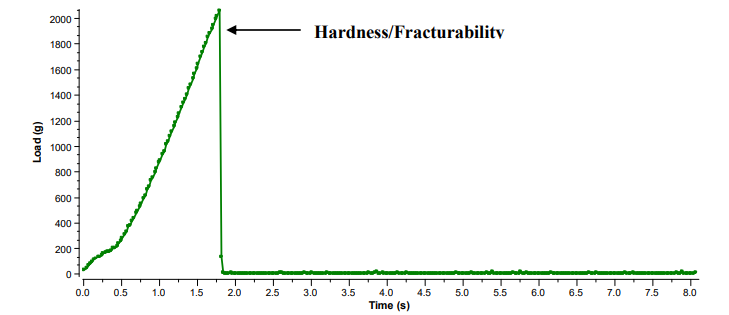
Figure IA load / time graph to show the breaking strength of dry lasagna using a three point bending attachment. The maximum force value is a measure of the hardness of the sample. The fracturing of the sample is measured at the force that generates the first fracture. The fracture value of this sample is similar to its hardness value indicating that the sample breaks immediately after its compressive force resistance has been exceeded. The gradient of the graph can also be measured to give the stiffness of the sample.
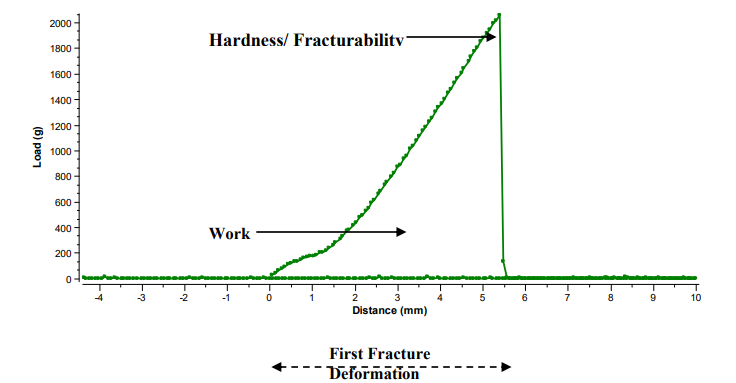
Figure II
Figure II A load / distance graph to show the tensile strength of dry lasagna using a three point bending attachment. This is an alternate option to view the results. The graph displays information similar to the load / time graph with two additional measurements. It is from the load / distance graph alone that the work performed and the flexibility of the sample can be measured. The first fracture strain distance is an indication of the flexibility of the sample such that the longer the distance, the more flexible the sample. The work done is the area under the graph and the energy required to overcome the strength of internal bonds within the sample.
Note: If only noodles are tested and there is no requirement for any other type of pasta, a 1000g or even 100g CT3 instrument can be used for this test.
OBSERVATIONS
When a trigger load of 15g has been reached at the sample surface, the probe will compress the sample at a test rate of 3mm / s over a distance of 5mm. During this time, the strength increases rapidly. When the applied force exceeds the resistance force of the sample, the sample reaches its breaking point and snaps as seen by the sudden drop in load / force values to zero. The maximum force value is a measure of the hardness of the sample (tensile strength). The area under the load / distance graph (Figure 2) is a measure of the work done. The gradient of the graph can also be measured to give an indication of the stiffness of the sample; the steeper the gradient, the stiffer the sample. From the load / distance graph, the distance to the point of failure (first failure strain) gives an indication of the flexibility of the sample. This is an indication of the extent to which a sample can be deformed prior to failure. The table below summarizes the average results of four samples:
| Hardness (g) | Fracturing (g) | Work performed (mJ) | Quantity of fractures | 1st breaking strain (mm) |
| Dry lasagna | 2114 ± 61 | 2114 ± 61 | 47.9 ± 2.9 | 1 | 5.41 ± 0.12
|
Since the amount of fractures generated with this sample is 1 it means that for this sample the fracture value will be the same as its hardness value.