Measurement of hardness, crunchiness and cracking of cookies

PRINCIPLE OF THE TEST
Comparison of the hardness, crunchiness and fracturing of biscuits by penetration.
CONTEXT
For this test, two cookies were tested: Sugar and Shortbread.
This test compresses the cookies to a set distance and measures the amount of force required to penetrate the surface of the cookie.
This simulates the force it takes for a human to bite a cookie. In some cases, when the surface is penetrated, the cookie may fracture or break.
Cookies will be placed between the TA39 probe and the Fixture Base Table (TA-BT-KIT). When the probe is lowered towards the sample, it will eventually pierce the surface and enter the cookie. This will provide data on the hardness and fracturing of the sample.
As the probe retracts, cookie fracturing will be measured. There are many types of cookies that have a wide range of properties including hardness, crunchiness, and fracturing. Structurally, not all cookies are the same. This test will measure and compare the hardness and fracturing of cookies.
METHOD
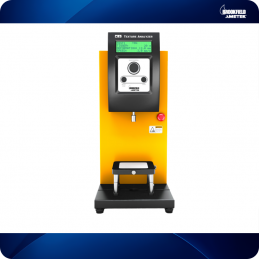
Equipment: Texture analyzer with 5000g load cell
Luminaire base table (TA-BT-KIT)
2 mm flat cylindrical probe (TA39)
Texture Pro software
SETTINGS:
Type of test: Compression
Target type: Distance
Target value: 3 mm
Trigger load: 15g
Pre-test speed: 0.5mm / s
Test speed: 0.5mm / s
PROCEDURE
- Attach the TA39 probe to the texture analyzer.
- Insert two table bolts into the slots in the analyzer base.
- Place the fixture base table on the texture analyzer and lightly tighten the nuts of the bolts.
- Adjust the table so that the probe is centered on the table.
- When alignment is complete, secure the base table by tightening the bolt nuts.
- Place a cookie on the table.
- Align the sample under the probe as centrally as possible.
- Slowly adjust the probe approximately 3 mm above the cookie sample.
- Set the test parameters using Texture Pro software.
- Start the test.
- Wipe the probe with a dry cloth after testing each cookie.
Repeat steps 1 through 11 for all samples.
OBSERVATION
When a trigger load of 15g is detected on the surface of the sample, the probe enters the cookie at a test speed of 0.5mm / s for a specified distance of 3mm. Once the distance of 3 mm is reached, the probe returns to its starting position.
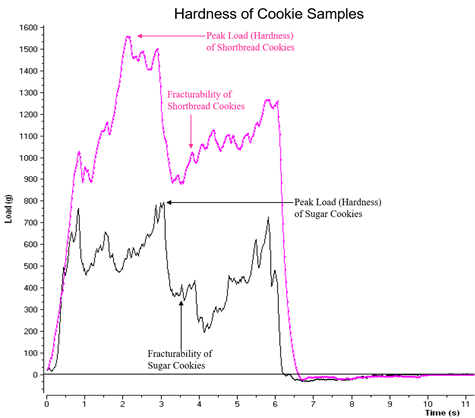
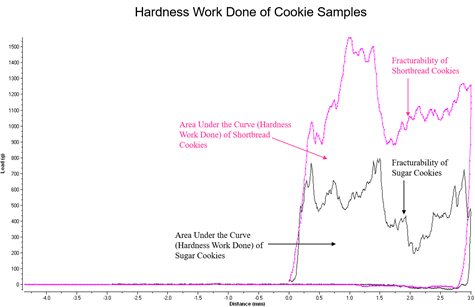
Each cookie has been tested four times. These results were averaged together. The graphs and table below report the data for these averages.
To show the difference between cookies, these values have been marked on the graph for both cookies.
DISCUSSION
The hardness work performed, which is the calculated area under the positive curve, indicates the hardness or toughness of the sample. A higher value implies that more work is required to chew the cookie.
Breakage occurs when there is a sharp decrease in load. The amount of fracture describes how crunchy and crunchy the cookie is when bitten, and is shown by the irregular fluctuations. These fluctuations are the result of cookie fracturing. The amount of breakage corresponds to the crunchiness of a cookie, indicating its fragility.
As the graphic above shows, the shortbread cookie had a higher average load between 1 and 15 seconds, indicating that overall it takes more work to chew and break down. Although not shown on the graph, the average peak load, or the average hardness of the cookies, is shown in the data report below.
If multiple tests are performed on the same cookie, care should be taken regarding the proximity between test holes and cracks from previous tests.
DATA REPORT
Texture Pro software is used to program and control the texture analyzer during experimental testing. It automatically calculates peak load values, hardness work performed, averages and standard deviations. Multiple samples can be analyzed if desired and the calculated values can be reported.
| # | Example description
Product Name | Lot name | Results
Hardness Cycle 1 (g) | Quantity of fractures | Average load (g) |
| 1 | Biscuit | sands | 1115.00 | 23.00 | 291.50 |
| 2 | Biscuit | Sugar | 1077.50 | 23.00 | 205.80
|
CONCLUSION
The test results can be used to determine the ideal hardness or crunch / crunchiness for different types of cookies. The test procedure, sample preparation, and equipment setup should be followed for reproducible and repeatable test results.