Case study: Measuring the spread of moisturizer

PRINCIPLE OF THE TEST
Evaluate the spread of two types of moisturizers using male and female conical probes.
CONTEXT
Moisturizers are used to keep the skin smooth, soft, looking radiant and healthy by retaining moisture or water in the outermost layer of the skin. Different moisturizers will be defined by their viscosity or their thickness. The formulation of moisturizers therefore largely depends on the required consistency of the final product influencing the choice of material to be used. For example, a cream rich in lipids will have reduced spreadability values with an increase in viscosity and surface tension (a measure of cohesion), making the cream oily, sticky and difficult to spread. The lower the viscosity of a cream, the lower the surface tension and the more easily the cream spreads and is absorbed into the skin.
METHOD
Equipment : CT3 with 4.5 kg load cell
Luminaire base table (TA-BT-KIT)
Double extrusion cell (TA-DEC)
TexturePro CT software
Settings :
Type of test: Compression
Pre-test speed: 1.0 mm / s
Test speed: 2.0 mm / s
Post-test speed: 2.0 mm / s
Target type: Distance
Target value: 25 mm
Trigger force: 10 grams
The spreading accessory quantifies the spread of samples. It consists of a set of paired male and female Perspex cones.
SAMPLE PREPARATION
Fill the four lower cones (female cones) with the sample using a spatula.
Level the surface using a flat knife.
PROCEDURE
Position the base table on the base of the machine.
Loosely tighten the base table screws to allow mobility.
Place the base stand on the base table and lock it in position with the screws.
Insert the female cone into the female. conical sample holder.
Attach the male cone to the load cell.
Precisely align the male and female cones by lowering the male cone and repositioning the female cone so that the male cone fits into the female cone.
The base table screws can now be tightened.
Before testing, the male probe should always be placed a few millimeters above the sample. Begin the test.
Remarks :
Accurate alignment of the probes is essential to avoid overloading the instrument.
Fluctuations on a smooth curve are the result of compressing air pockets. It is therefore important to minimize air pockets when filling the female cone.
The base holder should not be removed from the base table between tests as this will require realignment of the male and female probes. The female cone can be removed after the test by loosening the screws on the base support.
For comparison purposes, the test temperature should always be reported in the results.
RESULTS
The following graph shows the spreadability of two different types of moisturizers.
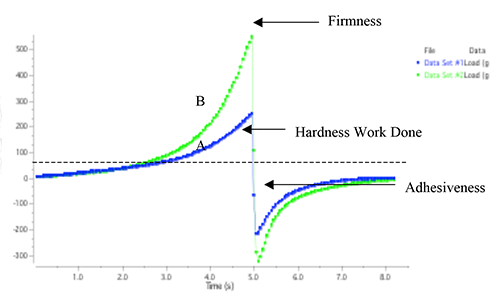
Figure I shows the spreadability of two types of moisturizers at 21 ° C using male and female 45 ° conical probes. For each test, the male cone was positioned 3mm above the sample surface.
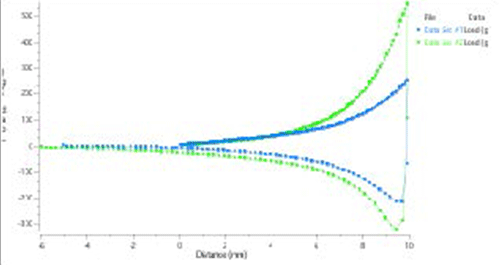
Data Set # 1: Sample A (Premium Moisturizer)
Data Set # 2: Sample B (Value Moisturizer)
Figure II is a load versus distance graph for the spreadability of two types of moisturizers.
Data Set # 1: Sample A (Premium Moisturizer)
Data Set # 2: Sample B (Value Moisturizer)
OBSERVATIONS
When a trigger force of 10 g has been reached, the probe enters the sample at a test speed of 2 mm / s to a depth of 25 mm. During this time, the penetrating force of the sample increases. When the specified penetration distance is reached, the probe withdraws from the sample at the post-test rate of 2 mm / s. The maximum force value on the graph is a measure of the firmness of the sample at the specified depth. The area under the positive curve is a measure of the energy required to deform the sample to the defined distance (Hardness Work Done). Research has shown that the firmness and energy required to deform a sample to a defined depth ranks samples in order of spreadability. A higher peak load (firmness) and a hardness value of the work performed indicates a less spreadable sample. Conversely, a lower peak load (firmness) value combined with a lower work performed value indicates a more spreadable sample. From Figure 1, sample B is significantly firmer than sample A and exhibits higher hardness work (area under the positive curve). This indicates that A is more spreadable than sample B.
When the probe returns to its starting position, the initial lift of the sample weight onto the top surface of the disc produces the negative portion of the graph. This gives an indication of the cohesion and resistance of the sample to separate (flow) from the disc. The maximum negative force on the graph indicates the adhesive strength of the sample; the more negative the value, the more “sticky” the sample. The area below the negative part of the graph is known as adhesion (the energy required to break the contact of the probe with the sample) and can give an indication of the cohesive forces of molecules in the sample. Sample B is more adhesive or “sticky” and therefore more cohesive than sample A. The tests obtained from 4 samples of each moisturizer formulation give the values of average hardness and work performed below:
| Hardness (g) | Hardness Work performed (mJ) |
| TO | 250.5 ± 57.5 | 6.94 ± 0.94 |
| B | 542.5 ± 48.6 | 8.58 ± 2.29 |