Soft cheese texture measurement
PRINCIPLE OF THE TEST
Comparison of the product smoothness of full, medium and low fat soft cheeses using a 45 ° conical probe to determine the spreadability and smoothness of the cheeses.
CONTEXT
Soft cheeses are cheeses with a moisture content between 48 % and 80 %. Whole soft cheeses should not contain more than 60 % moisture with a fat content greater than 20 %. Texture analysis plays a critical role in quantifying curd characteristics where it acts as a rheological predictor of finished product quality, as well as a potential indicator of moisture content. Stabilizing systems form solids, increase viscosity and improve product mouthfeel (creamy texture) and flavor release. Texture analysis therefore plays a critical role in the development of low fat foods where the product developer wishes to mimic the texture profile of the high fat counterparts.
This test compared:
1. Full of fat = 30 % fat, with 8 % protein
2. Light = 15 % fat, with 12 % protein
3. Very light = 6% fat, with 15% protein
PROCESS
Equipment : Texture analyzer with 1500g load cell
Luminaire base table (TA-BT-KIT)
45 ° conical probe (TA15)
Texture Pro Software Parameters:
Type of test: Compression
Test speed: 1 mm / s
Target value: 20mm
Trigger force: 4.5g
PROCEDURE
The samples were removed from the refrigerator at 6.8 ° C.
The sample was placed under the test probe and evaluated in the original container.
Three repeated tests were performed in the same sample. Three minutes passed between the first and the last test.
TYPICAL RESULTS
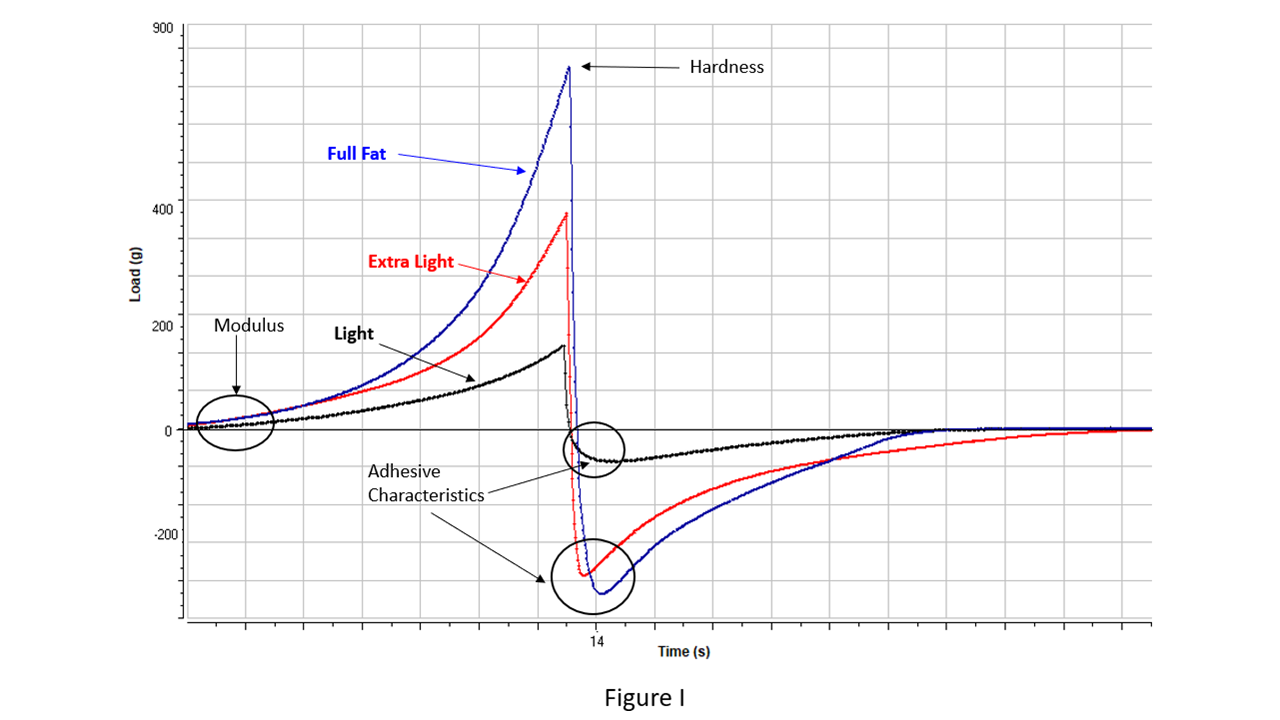
The deformation force curves of the three products show a dramatic variation in the texture characteristics. The fatty product is the most firmly fixed, having the highest values for modulus, hardness and adhesion. The semi-fat product had the lowest values of the three soft cheeses. The extra light sample exhibited characteristics between those of the other two materials.
SETTINGS
HARDNESS (g) Maximum positive charge reached in full cycle; Force required to achieve a given strain.
ADHESIVE STRENGTH (g) Maximum negative charge reached in full cycle; Force required to remove the probe from the sample.
MODULE (g / cm 2) Ratio of the stress of the sample divided by the strain during the first compression cycle, for example the slope of the force; strain curve in the linear region. It is representative of the stiffness of the sample.
RESULTS
| | Whole | Light | Very light (extra light) |
| HARDNESS (g) | 897 | 180 | 356 |
| ADHESIVE STRENGTH (g) | -140 | -33 | -60 |
| MODULE (g / cm 2 ) | 34.6 | 5.7 | 11.1
|
CONCLUSION
The whole product has the firmest texture. The light product is very soft in comparison. The extra light product sits between whole and light samples, with a structured consistency resulting from stabilization with increased milk protein and additives. The inclusion of these compounds failed to mimic the overall profile of the entire fat sample.