Roast chicken texture measurement
.jpg?la=en&revision=a89b575a-cfa5-438f-8932-5091a2f91886&hash=D7CD110BF9EC67F55FEDA759B74CE9E7)
PRINCIPLE OF THE TEST
Hardness / Firmness Assessment of Cooked Chicken Meat Using a Kramer Five-Blade Shear Cell (TA-KSC002)
CONTEXT
Texture is normally associated with the hardness and structure of the meat. Several factors will influence the hardness and structure of the meat, including the water-holding capacity (WHC), the tightness of the meat, marbled fat, connective tissue content and the size of the muscle bundles. Having a high WHC produces meat with a stronger structure and a dry texture. On the other hand, meat with a low WHC will have a soft, moist texture and the toughness of the meat is lost.
The Kramer shear cell with its multiple blades allows to shear samples with variable geometry. The results of hardness and of work carried out are therefore an average of the forces required to shear the sample with variable geometry. This fixture incorporates the textural methods of compressing, shearing and extruding through slots in the base of the cell.
METHOD
Equipment:
Instrument: CTX with 50 Kg
Accessory: TA-KSC Kramer shear cell
TA-BT-KIT luminaire base table
Software: Texture Pro software
Settings :
Type of test: Compression
Pre-test speed: 2.0 mm / s
Test speed: 2.0 mm / s
Post-test speed: 2.0 mm / s
Target type: Deformation
Target value: 35 mm
Trigger force: 5 grams
SAMPLE PREPARATION
Remove the sample from the storage area just before testing.
Weigh equal amounts of sample for the test
PROCEDURE
- Attach the probe containing the slides to the probe shaft of the instrument
- Place the fixture base table on the instrument base and lightly tighten the wing nuts to allow some degree of mobility
- Attach the Kramer shear cell to the fixture base table with the Perspex side facing forward and tighten in position using the thumbscrews
- Slowly lower the instrument arm and align the blades with the shear cell by repositioning the device base table so that the blades can clearly enter the shear cell through the slots without any frictional effect caused by the shear cell. blade touching the sides of the cell.
- When alignment is complete, tighten the wing nuts on the fixture base table to prevent further movement.
- Remove the blades by unscrewing the thumbscrew on the mount to provide room to place the sample in the shear cell.
- Place a weighed quantity of sample in the shear cell, then screw the blades back onto the assembly
- Lower the instrument arm so that the blades are a few millimeters from the sample surface.
- Start the test
Note: When testing a new sample, wash the device to remove traces of the previous sample. The weighed quantity of sample to be tested must be constant throughout the tests.
RESULTS
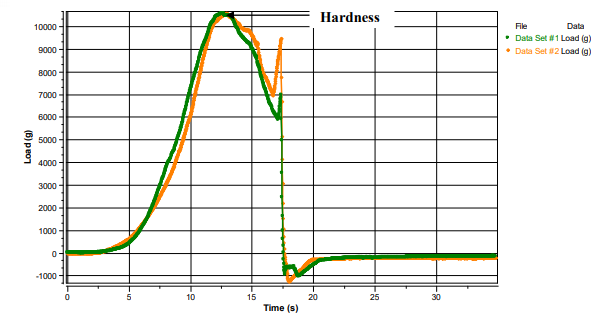
Figure I Load / Time Graph for Hardness / Firmness of 30g Chicken Cooked Using the Kramer Five-Blade Shear Cell
Two sample results from the same lot were overlaid. Maximum peak force is a measure of the hardness / firmness of the sample. Two samples were tested and superimposed.

Figure II The Load / Distance graph for the hardness / firmness of 30 g of cooked chicken.
Two sample results from the same lot were overlaid. The maximum force is a measure of the hardness of the sample. The area under the graph from the start of the test to the target distance point (30mm) is a measure of the work done.
OBSERVATIONS
At the start of the test, the blades approach the meat surfaces at a pretest speed of 2 mm / s. When a trigger force of 10g has been detected at the sample surface, the slides compress and penetrate through the sample a target distance of 35mm at a test speed of 2mm / s.
The maximum force value on the graph is a measure of the hardness / firmness of the sample. This value correlates with the amount of force required by the teeth to compress the sample; the higher the value, the stronger the sample (see Figures 1 and 2).
The area under the graph from the start of the test to the target strain distance (see Figure 2) is a measure of the work performed. This value correlates with the amount of energy required to overcome the strength of internal bonds within the sample. The higher the value, the more energy is required to decompose the sample.
The table below summarizes the results obtained from 12 tested samples of cooked chicken from the same lot:
| Hardness (g) | Work performed (mJ) |
| Cooked chicken | 14548 ± 600 | 1344.3 ± 29.4 |