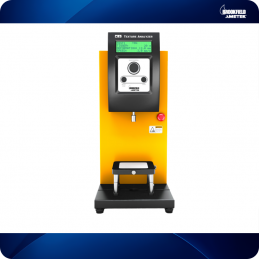
Candy hardness and crunch measurement

PRINCIPLE OF THE TEST
Evaluation of the hardness and crunchiness of candies.
CONTEXT
Sweets are made by dissolving sugar in water or milk and boiling the syrup until it reaches the desired concentration (thickness or consistency) or begins to caramelize. There are different kinds of candy depending on the ingredients used and how long the syrup cooks.
The final texture of a candy will depend on the sugar concentration which in turn depends on the boiling point. Higher boiling temperatures result in higher sugar concentrations as more of the water evaporates from the mixture, producing hard, brittle candies. Lower boiling temperatures, on the other hand, produce softer candies. Candies, therefore, come in a variety of textures ranging from soft and chewy to hard and brittle, for example jelly candies, fudge, caramel, candy canes, lollipops and hard candies, between others.
In addition to the boiling point, a change in formulation, for example, will affect the texture of the final product. Therefore, it is necessary to perform routine tests on the texture of the sweet product to ensure consistency from sample to sample.
The texture analysis using the texture analyzer with the confectionery jig and the cylindrical probe can measure the firmness, fracturing and the amount of fracture of hard candy. The robustness of the instrument also allows testing directly from the production line.
METHOD
Equipment : CTX texture analyzer with 50 kg load cell
Luminaire base table (TA-BT-KIT)
Cylindrical probe 2mm (TA39)
Confectionery jig (TA-CJ)
Texture Pro software
Settings :
Type of test: Compression
Pre-test speed: 1 mm / s
Test speed: 1 mm / s
Post-test speed: 1 mm / s
Target type: Deformation
Target value: 15mm
Trigger force: 15g
PROCEDURE
Attach the 2mm cylindrical probe to the load cell probe rod.
Place the fixture base table on the base of the CTX Texture Analyzer and tighten in position using the side screws.
Place the confectionery jig on the fixture base table and tighten in position using the thumbscrews.
Place the sample in the confectionery jig so that it is aligned with the center of the mounting opening, then tighten in position using the four screws. Tightening must be done up to the point of first resistance of the sample. Any additional tightening will compress the sample.
Lower the probe approximately 5mm above the confectionery jig.
Align the opening of the confectionery jig with the probe above by repositioning the base table and ensure that the probe can enter the opening of the confectionery jig without friction with the sides of the jig.
When alignment is complete, tighten the thumbscrews on the fixture base table to prevent any
additional movement.
Start the penetration test.
After each test, clean the cylinder probe and assembly before proceeding to the next test. The samples were removed from the refrigerator at 6.8 ° C.
Note: For comparison purposes, samples should be placed in the confectionery jig in the same orientation.
The sample in the confectionery jig should be placed in the center under the probe.
The penetration distance chosen for the test depends on the height of the sample. For thicker samples, greater depths can be used. When comparing, the test conditions should be kept the same for all samples tested.
When optimizing test parameters, the harder sample should be tested first in order to anticipate the maximum test range for subsequent samples. This will ensure that the force capacity covers the range for other future samples.
RESULTS
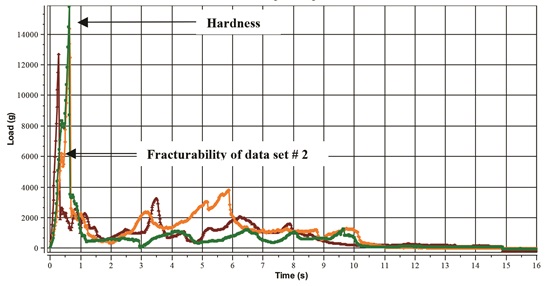
Figure I shows the load / time graph for the hardness of the candy using a confectionery jig and a 2mm cylindrical probe. The maximum force is a measure of the hardness of the candy, this value correlates with the force required to penetrate the hard candy with the molars. The fracture value is the force required to generate the first fracture and gives an indication of the brittleness of the product; the higher the value, the less brittle the candy. The fluctuations on the graph represent the fractures generated in the test from which the amount of fractures is calculated to give candy crunch values.
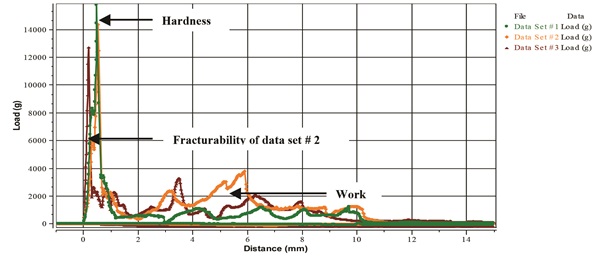
Figure II shows the load / distance graph showing the work done to penetrate the candy. This graph shows the hardness and fracturing of the candy but also the energy required to overcome the structural constitution of the candy during its deformation with the molars. This is the work done measured by the area under the graph.
OBSERVATIONS
When a trigger of 15g has been reached on the surface of the candy, the probe proceeds to compress and deform the candy over a chosen distance (in this example 15 mm). As the probe deforms the sample, the force / load is seen by the rapid rise (see graphics). The hardness of the candy is determined by the maximum force on the graph (Figure I and II). This correlates with the force required to penetrate the candy with the molars.
The area under the graph on the load / distance graph (Figure II) is a measure of the work done which correlates with the energy required to overcome the strength of the internal bonds within the candy when the candy is deformed. The amounts of fractures generated in the test (see Figures I and II) give an indication of the crunchiness of the sample; the higher the value, the crispier the sample.
The breaking characteristics of the candy (i.e. hardness, fracturing and crunch) provide very useful information in the product development process to optimize product formulation, cooking times, humidity of the product, as well as to verify the ideal sensory preference of the product. product.
The table below summarizes the average results taken from 12 samples:
| # | Example description
Product Name | Hardness (g) | Work performed (mJ) | Fracture amount s |
| 1 | Candies | 14068 ± 1051 | 156.8 ± 42.3 | 17 ± 4
|