Potato firmness measurement

PRINCIPLE OF THE TEST
Evaluation of potato hardness with different compression cooking times using the CTX and Kramer shear cell
CONTEXT
Potato cells have a rigid cell wall which is a polymeric network of polysaccharides, the middle lamella of which forms the outer layer of the cell wall. The middle lamella mainly consists of pectic material and binds the cells together. During heating, the structure of the cell wall is affected, resulting in loss of cell adhesion. The integrity of the cell membrane is also lost, resulting in loss of turgor pressure and free diffusion of cell contents. As a result, the starch grains in the cells absorb water and swell to form a gel. Heating the potatoes therefore causes swelling of the starch grains and softer tissue through which the cells are more easily separated. The extent to which these processes occur depends on the cooking time. When the baked potato is subjected to a compressive or shearing force, the breaking of the potato occurs at the middle lamella.
The texture of potatoes can be described as floury consistency (mouth feel), wax, flaking and firmness. Firmness is related to the swelling and gelatinization of starch as well as the stability of pectic substances in the cell wall and the middle lamella.
The texture analyzer can measure the firmness, shear, elasticity and stickiness of potatoes during a compression test; in addition, cohesion, chewiness and gummy character can be measured in a texture profile analysis (TPA) test.
This app measures the firmness of potatoes at different cooking times using the Kramer shear cell. The Kramer shear cell with its multiple blades can shear samples of varying geometry, which means that the results of hardness and work performed are an average of the forces required to shear the sample. The test method incorporates the textural methods of compression, shear and extrusion through slots in the base of the cell.
Potato texture analysis can be used for quality control purposes, predicting consumer acceptance of the product, performing shelf life studies, and studying the effects on the texture of potatoes. ingredient / formulation changes.
METHOD
Equipment:
CTX instrument
100Kg load cell
TA-KSC002 Kramer shear cell with five blades
TA-BT-KIT luminaire base table
Texture Pro CT software
Settings :
Type of test: Compression
Pre-test speed: 1.0 mm / s
Test speed: 1.0 mm / s
Post-test speed: 1.0 mm / s
Target type: Distance
Target value: 60.0 mm
Trigger force: 50 grams
SAMPLE PREPARATION
Remove the cooled potatoes from storage just before testing. Dice the potatoes and weigh equal amounts for testing. The sample quantity should occupy about 70 % of the filling capacity of the cell.
PROCEDURE
- Attach the slides to the probe shaft of the instrument.
- Place a fixing base table on the base of the instrument and lightly tighten the wing nuts to allow some degree of mobility.
- Insert an empty Kramer shear cell onto the base table with the Perspex side facing forward and tighten in position using the thumbscrews.
- Align the slides to the Kramer cell by lowering the slides and readjusting the positioning of the Kramer cell so that the slides can be lowered into the cell without touching the edges of the cell.
- When alignment is complete, tighten the base table wing nuts to prevent further movement.
- Place a collection drawer under the Kramer cell to collect any extruded sample.
- Remove the slides by unscrewing the slide holder from the holder so that the weighed sample can be placed in the cell.
- Place the weighed sample in the Kramer cell and spread it out to create a flat surface.
- Screw the blade holder onto the support. The blades should now be back in their aligned position.
- Lower the slides a few millimeters above the sample surface.
- Start the test.
- When proceeding to the next test, remove the slides to allow easy cell removal and clean the slides and cell with water to remove all traces of the previous sample.
Note: When optimizing test parameters, it is best to test the hardest sample first in order to predict the maximum test range for subsequent samples.
RESULTS
Number I
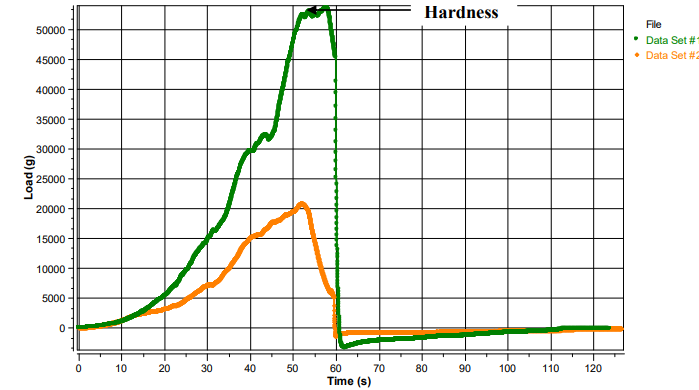
Figure I The Load / Time Graph for Potato Firmness at Different Cooking Times Maximum peak force is a measure of the hardness of the sample, the higher the value, the harder the sample. 2 minutes and 8 minutes
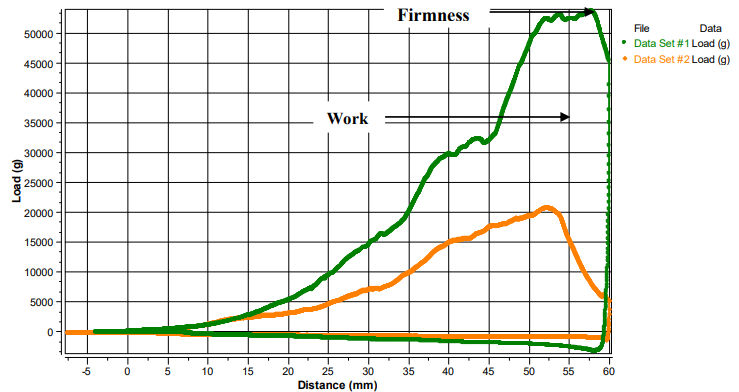
Figure II The Load / Distance graph for the firmness of potatoes at two different cooking times. The maximum peak force is a measure of the toughness of the sample. The area under the curve from the start of the test to the remote target point (60mm) is a measure of the work performed. 2 minutes and 8 minutes
OBSERVATIONS
When the test begins, the slides move at a pre-test speed of 1 mm / s up to the sample surface. When a trigger force of 50 g has been detected at the surface of the sample, the slides begin to compress the sample a specified distance (60 mm in this test) at a test rate of 1 mm / s during which the sample is compressed to pack. more tightly, thus eliminating air pockets before shearing can begin. The sample is then sheared and extruded through the cell. The maximum force value on the graph is the force required to compress and shear the sample which is a measure of the hardness of the sample. This value correlates with the bite force required to shear (cut) the sample with the teeth on the first bite. The higher the value, the harder the sample (see Figure 1 and 2). The area under the graph from the start of the test to the target distance (see Figure 2) is a measure of the work done. This value correlates with the amount of energy required to overcome the strength of internal bonds within the sample. The higher the value, the more energy is required to deform and shear the sample.
The table below summarizes the results:
| Cooking time | Hardness (g) | Work performed (mJ) |
| 2 minutes | 53600 | 11774.7 |
| 8 minutes | 20845 | 4858.4 |