Banana Crisps Hardness and Crispness Measurement

OBJECTIVE OF THE TEST
Determination of the hardness and crispness of banana chips using a Brookfield CTX texture analyzer and a three-point curvature device (TA-TPB).
CONTEXT
Banana chips are typically produced from slices of underripe bananas fried in oil. These crisps are dry (like crisps) and can be salty, spicy, and coated in sugar. Banana chips are most often associated with a crispy, crispy texture. The hardness and crispness of the banana chips will be tested using a three point bend (TA-TPB).
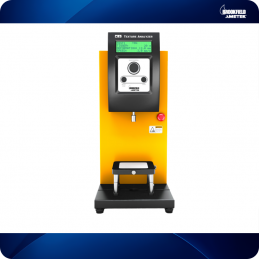
The crisps were stored overnight at room temperature. A CTX texture analyzer (Figure 1) with a 10 kg load cell was used with a TA-TPB apparatus (Figure 2) to perform a compression test.
This test compresses the banana chips a set distance and measures the force required to bend or break the sample.
The banana chip sample will be placed between the TA-TPB fixture and the fixture base table (TA-BT-KIT). When the blade is lowered towards the sample, it will eventually create pressure with the lower blades and bend the banana chip sample until it breaks. This will provide data on the hardness and crispness of the chip sample.
EQUIPMENT
CTX with 10 kg load cell (XCTX)
Fixing base table (TA-BT-KIT) Bending software in
three points junior (TA-TPB)
Texture Pro (SWL-02-111)
Settings:
Type of test: Compression
Target type: Distance
Target value 3.5mm
Trigger load: 100g
Pre-test speed: 1 mm / s
Test speed: 1 mm / s
SAMPLE PREPARATION
1. The sample was stored overnight at room temperature in its original packaging.
2. The sample was removed from the packaging immediately prior to testing.
3. Sort and select nearly similar samples for testing.
PROCEDURE
1. Attach the TA-TPB slide to the CTX texture analyzer.
2. Insert two table bolts through the slots in the analyzer base.
3. Place the fixture base table on the CTX and lightly tighten the bolt nuts.
4. Attach the TA-TPB bottom fixture to the fixture base table. Tighten the side screws to secure the fixture to the table.
5. Adjust the table so that the probe is centered on the table.
6. When alignment is complete, secure the base table by tightening the bolt nuts.
7. Slowly lower the upper blade until it passes evenly through the lower blades. This ensures correct alignment, accurate data and test repeatability.
8. Place the sample on the lower slides. Align the sample under the slide probe as centrally as possible.
9. Position the probe approximately 1 mm above the banana chip sample.
10. Set the test parameters using Texture Pro software.
11. Start the test.
12. Repeat steps 1 through 11 for all samples.
OBSERVATION
When a trigger load of 100g is detected on the sample surface, the probe compresses the banana chip at a test rate of 1mm / s over a specified distance of 3.5mm. During compression, the sample exerts resistance to the force applied by the upper probe. When the applied force exceeds the resistive force, the sample breaks. Once the distance of 3.5 mm is reached, the probe returns to the starting position.
The Load vs. Time (Figure 6) indicates the hardness of the sample. The Load vs Distance graph shows the work done to compress and bend the samples.
Banana chips have been tested three times and these tests have been averaged together. The graphs below report data for this average.

The graph above displays the maximum positive loads for the samples tested.
The axes are Load (g) versus Time (s).
DISCUSSION
The maximum load value is the peak load. It is a measure of the firmness of the sample; the higher the value, the firmer the sample and the more work it takes to compress the sample. The hardness indicates the maximum force required to compress a food between the molars, while the hardness work done is the work required to overcome the bonds inside (to chew) a food.
Breakage occurs when there is a sharp decrease in load. Sensitivity can be used to specify the minimum drop required and is expressed as a percentage of hardness. If the amount of fractures is calculated, all fractures will be marked on the graph. Quantity of Fractures provides a strong indication of the crunchiness of banana chips by measuring the number of fractures during the first compression stroke (only one compression stroke was used in this test). Another key indication is fracturing, which reveals the brittleness of the samples tested.
CONCLUSION
The test results can be used to determine the ideal hardness and crispness of banana chips. The three samples tested had an average hardness value of 2,652 g force. This was the force required by the texture analyzer (with a plastic shear blade) to break or snap the banana chip in half. It is by this value that the user (s) must determine whether the banana chip is too hard or soft for the required texture. The samples also have a similar amount of fractures, indicating a crunch. However, the level of brittleness, which is the fracturing value, shows large differences between the three samples. The fracture value is particularly useful when comparing different brands of a sample. Testing can be used to facilitate production consistency and quality control, optimize the texture attributes of a product, perform shelf life testing,