Case Study: Hair Gel Texture Measurement
PRINCIPLE OF THE TEST
The objective was to compare the consistencies of two types of hair gels by back extrusion.
CONTEXT
The formulation of hair gels depends largely on the required consistency of the final product, thus influencing the choice of material to be used. A desirable factor in product development is to have a product that flows easily from a tube and breaks cleanly after being squeezed. With the use of front and rear extrusion tests, these consistencies can be assessed. The forward extrusion simulates the force required by the consumer to extrude the sample and the backward extrusion is an indication of the physical failure and viscosity of the product.
METHOD
Equipment: CT3 with 4.5 kg load cell
Round base table (TA-RT-KIT)
Rear extrusion cell (TA-BEC)
THE SETTINGS
Type of test: Compression
Type of pre-test: 1.0 mm / s
Test speed: 2.0 mm / s
Post-test speed: 2.0 mm / s
Target type: Distance
Target value: 25 mm
Trigger force: 10 grams
Note: It is recommended that the pre-test speed be the same or slower than the test speed for accurate trigger detection; for example, a test speed of 1 mm / s will require a pre-test speed ≤ 1 mm / s.
The chosen target distance should be such that the probe does not distort the sample more than 75 % depth of the sample, otherwise the base effect may affect the results.
PROCEDURE
1. Position the extrusion disc in the center of the sample container.
2. Remove the sample kept at a specific temperature (eg 25 ° C) from storage.
3. Fill the extrusion container with the sample up to about 75 %.
4. Calibrate the probe at a specified starting distance (for example, 30mm) above the top of the vessel or the sample surface. This will ensure that the probe returns to the same position above the samples after each test, allowing comparisons of the cohesion and “cohesive work” of the samples.
5. As the probe withdraws from the sample, hold the container firmly to prevent it from lifting.
RESULTS
Comparison of the consistencies of two types of hair gel by back extrusion. Figure I The graph of Figure I shows the consistencies of two types of hair gels stored and tested at 21 ° C in a 40mm diameter rear extrusion container. Data Set # 1: Sample A (Premium Hair Gel) Data Set # 2: Sample B (Economy Hair Gel) Figure II
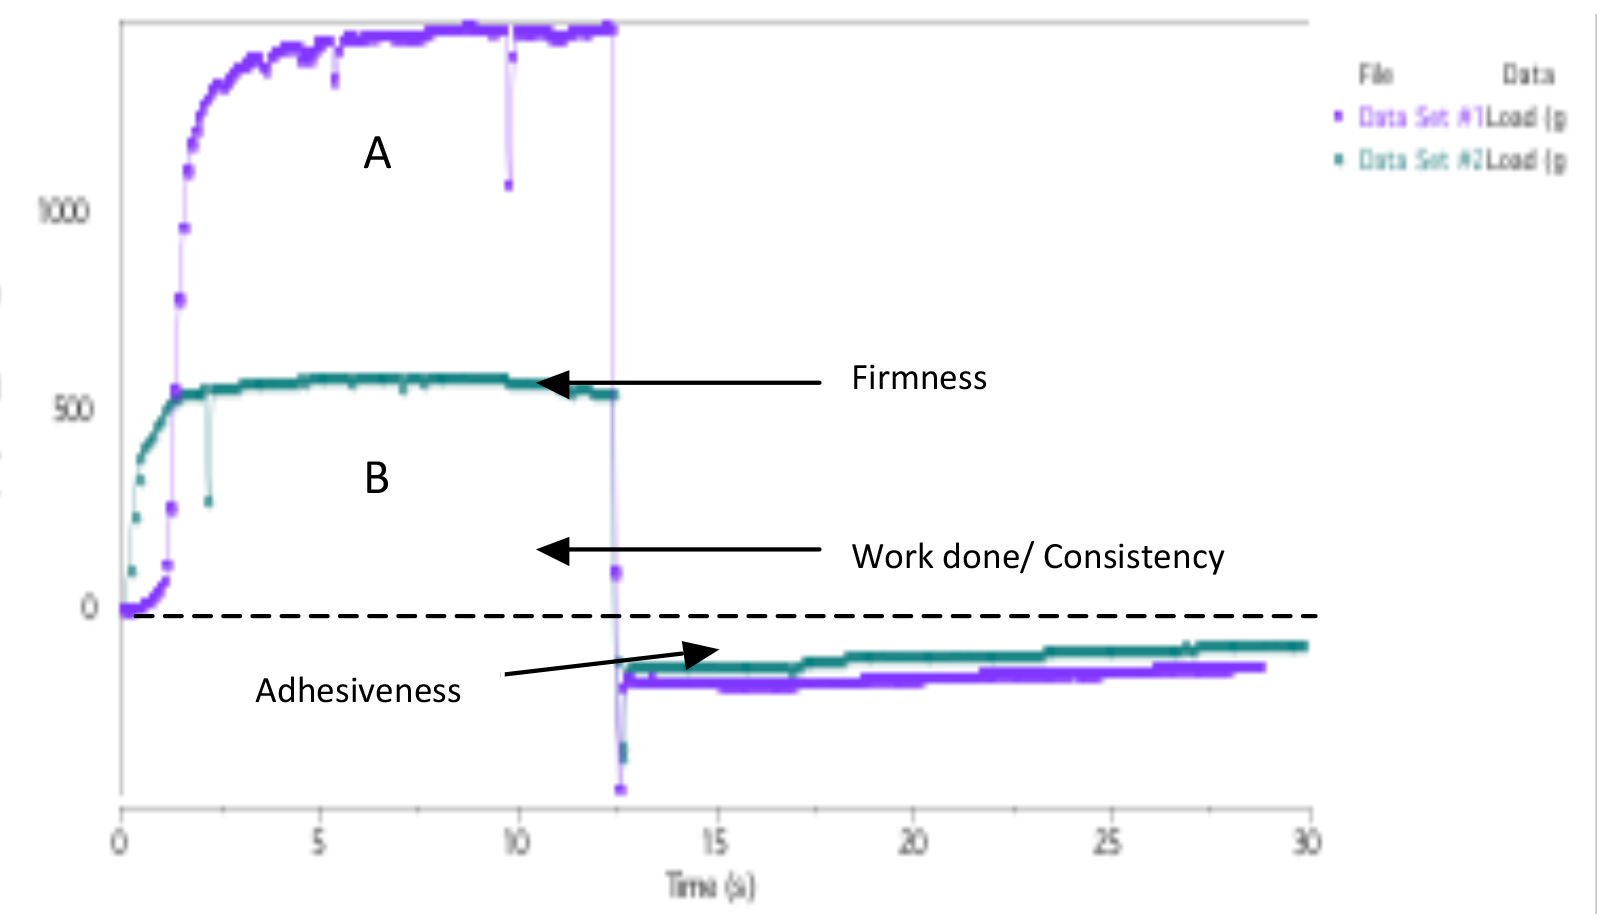
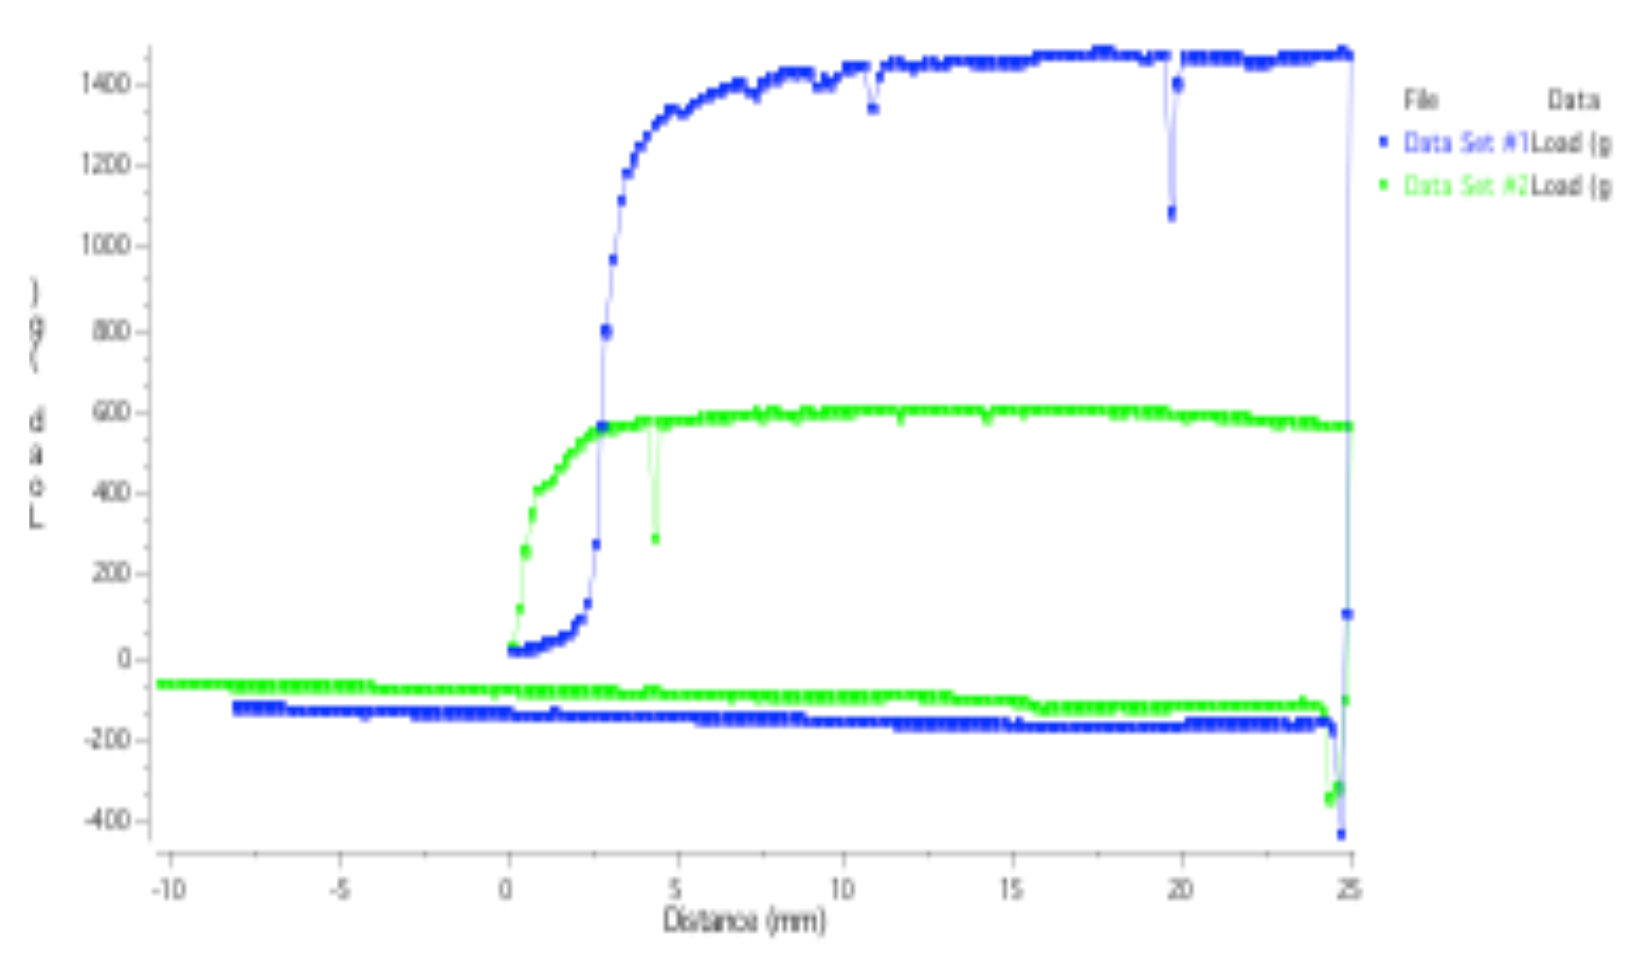
Figure II is a load strain graph showing the consistencies of two types of hair gel.
Data set # 1: sample A (premium hair gel)
Data set # 2: sample B (economy hair gel)
OBSERVATIONS
When a trigger force of 10 g has been reached, the disc piston begins to deform the sample to a specified distance (25 mm), after which the probe returns to its starting position. The maximum force represented by a peak on the graph is a measure of firmness; the higher the value, the firmer the sample. The area under the positive part of the graph indicates the consistency of the sample (work performed up to hardness 1); the higher the value, the thicker the sample and the higher the consistency. When the probe returns to its starting position, the initial lift of the sample weight onto the top surface of the disc produces the negative portion of the graph resulting from the back extrusion. This gives an indication of the cohesion and resistance of the sample to separate (flow) from the disc. The maximum negative force on the graph indicates the adhesive strength of the sample; the more negative the value, the more “sticky” the sample. The area below the negative part of the graph is known as adhesion (the energy required to break the contact of the probe with the sample) and can give an indication of the cohesive forces of molecules in the sample. The higher the value, the more energy it takes to break the contact of the probe with the sample when the probe withdraws from the sample. From figure 1, sample A is firmer and has a higher consistency than sample B. In addition, sample A has a higher adhesive component than sample B. The area under the part The negative of the graph is known as adhesion (the energy required to break the contact of the probe with the sample) and can give an indication of the cohesive forces of molecules in the sample. The higher the value, the more energy it takes to break the contact of the probe with the sample when the probe withdraws from the sample. From figure 1, sample A is firmer and has a higher consistency than sample B. In addition, sample A has a higher adhesive component than sample B. The area under the part The negative of the graph is known as adhesion (the energy required to break the contact of the probe with the sample) and can give an indication of the cohesive forces of molecules in the sample. The higher the value, the more energy it takes to break the contact of the probe with the sample when the probe withdraws from the sample. From Figure 1, Sample A is firmer and has a higher consistency than Sample B. In addition, Sample A has a higher adhesive component than Sample B.