Case Study: Moisturizer Firmness Measurement

PRINCIPLE OF THE TEST
Evaluation of the consistencies of two types of moisturizers by penetration using a hemispherical probe.
CONTEXT
Moisturizers are used to keep the skin smooth, soft, and looking radiant and healthy by retaining moisture or water in the outermost layer of the skin. Different moisturizers will be defined by their consistency. The formulation of moisturizers therefore largely depends on the required consistency of the final product, influencing the choice of material to be used. The penetration test, using a hemispherical probe, is an imitation test simulating the ease with which a human finger will deform the sample when applying the cream. This test makes it possible to evaluate the consistency of the creams. Samples can also be tested in their containers directly from the production line.
METHOD
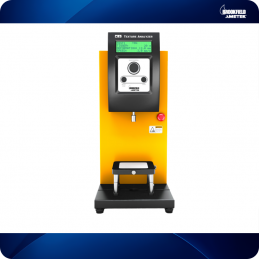
Equipment : CT3 with 4.5 kg load cell
Luminaire base table (TA-BT-KIT)
Double extrusion cell (TA-DEC)
TexturePro CTParameters:
Type of test: Compression
Pre-test speed: 1.0 mm / s
Test speed: 2.0 mm / s
Post-test speed: 2.0 mm / s
Target type: Distance
Target value: 25 mm
Trigger force: 10 grams
Note: It is recommended that the pre-test speed be the same or slower than the test speed for accurate trigger detection; for example, a test speed of 1 mm / s will require a pre-test speed ≤ 1 mm / s.
The chosen target distance should be such that the probe does not distort the sample more than 75 % depth of the sample, otherwise the base effect may affect the results.
PROCEDURE
Attach the hemispherical probe to the load cell.
Align the sample in the center under the probe.
Start the test.
When the probe withdraws from the sample and returns to the starting position, firmly hold the sample down to prevent it from lifting.
Be sure to wipe the probe thoroughly with a clean, dry cloth to remove any stuck soap before proceeding to the next test.
Note: When optimizing the test parameters, the harder sample would be best tested first in order to anticipate the maximum test range required. This will ensure that the force capacity covers the range for other future samples.
The penetration test can also indicate if there are trapped air bubbles or a grainy texture, considered fluctuations in force, when the probe comes in contact with air bubbles or hard particles.
RESULTS
The following is a typical penetration plot from the texture analysis of two different types of moisturizer.

Figure I compares the hardness of two different moisturizer formulations tested at 21 ° C.
Data Set # 1: Sample A (Premium Moisturizer)
Data Set # 2: Sample B (Value Moisturizer)

Figure II shows a load versus distance graph comparing the hardness of two different moisturizer formulations.
Data Set # 1: Sample A (Premium Moisturizer)
Data Set # 2: Sample B (Value Moisturizer)
OBSERVATIONS
When a trigger force of 10g is reached, the probe begins to penetrate the sample at a set distance (25mm in this case). The maximum positive force then becomes the value of the force, the firmer the sample is. From Figure I, Sample A is firmer than Sample B and is also more adhesive. The energy required to distort the samples can be quantified by selecting Work Done Hardness 1 in the software. This is the area under the positive curve. As can be seen in the table below, Sample A requires more energy than Sample B to deform the sample to a defined strain distance.
| Sample | Hardness (g) | Hard work done |
| TO | 70.5 | 14.91 |
| B | 57.1 | 11.38 |