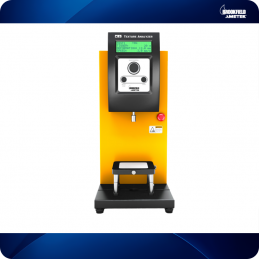
Hamburger texture measure

PRINCIPLE OF THE TEST
Comparison of the firmness, hardness of the job done, tackiness and adhesion strength of burger patties cooked by compression with a small 9mm shear blade.
CONTEXT
Burgers are a staple of American cuisine and are commonly eaten at restaurants, sporting events, and parties. Burgers are generally round, served as a pancake. The burgers tested in this experiment are beef, but burgers with turkey, black beans, vegetables and tofu are also common.
This test compresses the hamburger patties a set distance and measures the force required to penetrate the patty. The TA52 blade simulates the force required for human teeth to bite and cut a hamburger.
METHOD
Equipment : Texture analyzer with 10 kg load cell
Luminaire base table (TA-BT-KIT)
Small shear blade (TA52)
Texture Pro software
Settings :
Type of test: Compression
Target type: Distance
Target value: 10 mm
Trigger load: 30g
Pre-test speed: 1 mm / s
Test speed: 1 mm / s
SAMPLE PREPARATION
The sample is kept overnight in the refrigerator before testing and fully cooked just before testing.
Samples were tested within 10 minutes of baking.
All the patties have been cut to the same shape and size.
Note: Due to the inherent differences between individual patties, baking and cutting will not be entirely exact between patties.
PROCEDURE
- Attach the TA52 shear blade to the texture analyzer
- Insert two table bolts into the slots in the base of the instrument.
- Place the fixture base table on the texture analyzer and lightly tighten the bolt nuts.
- Adjust the table so that the probe is centered on the base table.
- When alignment is complete, secure the base table by tightening the bolt nuts.
- Place the hamburger sample on the table. Align the sample under the probe as centrally as possible.
- Position the probe approximately 3 mm above the sample.
- Set the test parameters using TexturePro software.
- Start the test.
- Wipe the probe with a dry cloth after each test.
- Repeat steps 1 through 11 for all samples.
Note: Three tests were performed on each wafer. Each test was equidistant from the edges and the center of the cake.
OBSERVATION
When a trigger load of 30g is detected at the sample surface, the shear blade enters the hamburger patty at a test speed of 1mm / s for a specified distance of 10mm. Once the distance of 10 mm has been reached, the probe returns to the starting position. The following graph displays the maximum load (firmness) for the cooked burger patty tested.

DISCUSSION
The value of the maximum force is the maximum load. It is a measure of the firmness of the sample; the higher the value, the harder the sample. The higher the maximum load, the more labor required to decompose the sample. The hardness work performed is a measure of the amount of work required to overcome the strength of bonds within a food, and is represented by the enclosed area below the Load vs Distance graph (not shown in this example). The hard work done culminates in the first bite of a cooked burger.
DATA REPORT
TexturePro software is used to program and control the texture analyzer during experimental testing. It automatically calculates peak load values (hardness) and hardness work performed. Multiple samples can be analyzed if desired, and the calculated values for the standard deviation can be reported.
| # | Example description
Product Name | Lot name | Results
Hardness Cycle 1 (g) | Hardness Duty cycle 1
(mJ) |
| 1 | Hamburger, Cooked | Patty TA52 | 724.00 | 39.40 |
| 2 | Hamburger, Cooked | Patty TA52 | 607.00 | 40.90 |
| 3 | Hamburger, Cooked | Patty TA52 | 687.00 | 43.90 |
| | | | | |
| | | Minimum: | 607.00 | 39.40 |
| | | Maximum: | 724.00 | 43.90 |
| | | Medium: | 673.00 | 41.40 |
| | | Standard deviation: | 60.00 | 2.30
|
CONCLUSION
The test results can be used to determine the ideal hardness of cooked burgers. The test procedure, sample preparation, and equipment setup should be followed for reproducible and repeatable test results.