



Is Bubble Tower Temperature Calibration in Corrosion Testing Really Necessary ?
Is Bubble Tower Temperature Calibration in Corrosion Testing Really Necessary ?

 AMETEK BROOKFIELD
 ASCOTT ANALYTICAL EQUIPMENT LTD
 ATP ENGINEERING BV
 BINDER GmbH
 BUCKLEYS (UVRAL) LTD
 COATMASTER
 DAKOTA ULTRASONICS
 DEFELSKO CORPORATION
 FORMAT MESSTECHNIK GmbH
 HACH LANGE
 HANGON
 HANNA INSTRUMENTS FRANCE
 HILDEBRAND
 KERN & SOHN GmbH
 LABOMAT ESSOR
 LAUDA
LAUDA
 LENETA COMPANY
 MITUTOYO FRANCE
 Q-LAB CORPORATION
 RHOPOINT INSTRUMENTS
 RK PRINT COAT INSTRUMENTS Ltd
 SIGMUND LINDNER GmbH
 TABER INDUSTRIES
 TAYLOR HOBSON LIMITED
 TESTO
TESTO
 TQC BV
 VEOLIA WATER STI
 VERIVIDE
 WALLACE
 X-RITE EUROPE GMBH


Thickens sauces and gravies and is used for cooking.
Instrument: powder flow tester (PFT)
Tank: 230 cc, 6 inches in diameter (standard volume)
Lid Type: Pallet Lid, 33cc, 6 inch diameter
Wall cover, 2B finish, 6 inches in diameter
Test Type: Flow Function Test, Wall Friction Test
Temperature: Room temperature (70-72 ° F)
Humidity: 47.5%
A Brookfield powder flow tester equipped with Powder Flow Pro software for automated instrument control and data acquisition. The corn starch was picked up in the trough, and the scraping tool was then used to evenly distribute the powder in the trough. After recording the sample weight and entering it into the software, a standard flow function test and then a wall friction test were performed. The time required for each test was 25 minutes and 13 minutes respectively.
Fluidity: Very cohesive to fluid
Wall friction: 35 ° to 29 °
Apparent density: 625 kg / m 3 (filling density) to 800 kg / m 3
Hopper shape: Conical
Critical arch dimension: 63.1 mm (2.5 in.)
Figure 1 shows the fluidity of corn starch at different levels of consolidation stress. These results show that corn starch, at consolidation stress levels above 6 kPa, is a more easily flowing material. On the other hand, at very low consolidation stresses of less than 1.4 kPa, the starch falls into the very cohesive range and flows with greater difficulty.
Note: Flow function data is indicated by the red line. When interpreting a flow function graph, the data is read from right to left. The rightmost data point indicates the powder flow rate when the hopper is full; the leftmost data point indicates the powder flow when the hopper is nearly empty. Purple lines are standard flow indices that distinguish different types of flow behavior across levels of consolidation, ranging from “free fluid” (lower segment) to “non-fluid” (upper upper segment).

Figure 1: Graph of the Compression Ratio Function of Corn Starch
Figure 2 shows the friction angle of the walls at different levels of normal stress. The wall friction angle represents the friction between the sliding powder and the wall of the hopper or chute at the start of flow. In this test, a stainless steel cover was used, illustrating what the friction would look like if the corn starch was in a stainless steel hopper. At a low normal stress of about 0.5 kPa, the effective wall friction angle is about 35 ° and drops to about 29 ° at higher levels of normal stress (4.75 kPa).
Note: Wall friction test and flow function test are independent tests. The flow function test measures the flow of powder through the orifice while the wall friction test measures the flow of powder against a specific building material.
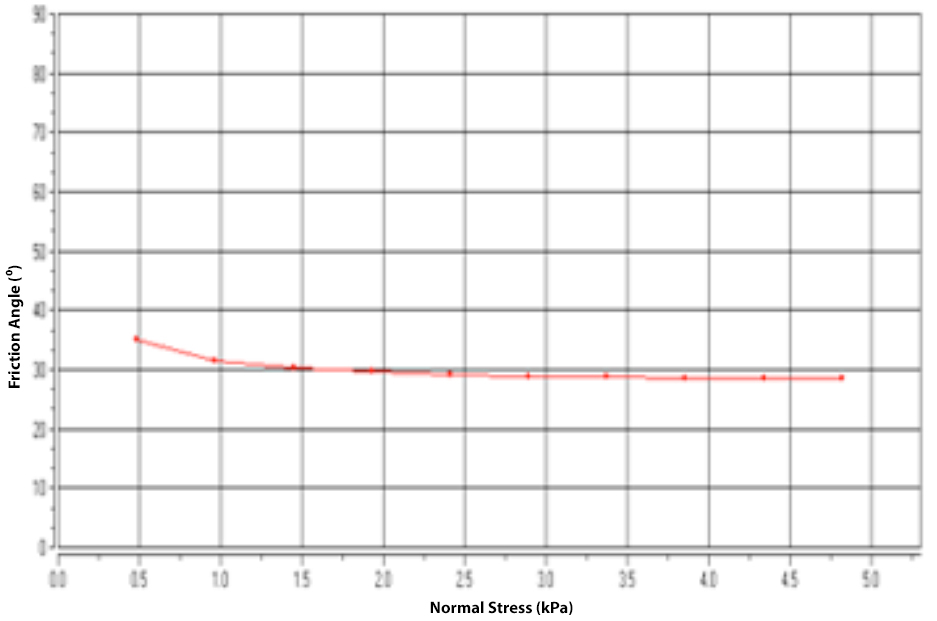
Figure 2: Corn Starch Wall Friction Graph
Figure 3 shows the bulk density of the material at different levels of consolidation stress. This graph tells us that corn starch has a filling density of about 625 kg / m³ and amounts to about 800 kg / m³ at about 11 kPa of consolidation stress. In general, a powder that flows more easily will show very small changes (less than 30%) in bulk density, while a cohesive or poorly flowing powder will generally show a large increase (greater than 30%) of the bulk density. In this case, the change in bulk density is 28 %. This material is on the verge of being a more cohesive and difficult to flow material. This is supported by the flow function test which shows that the material flows easily initially at higher consolidations.
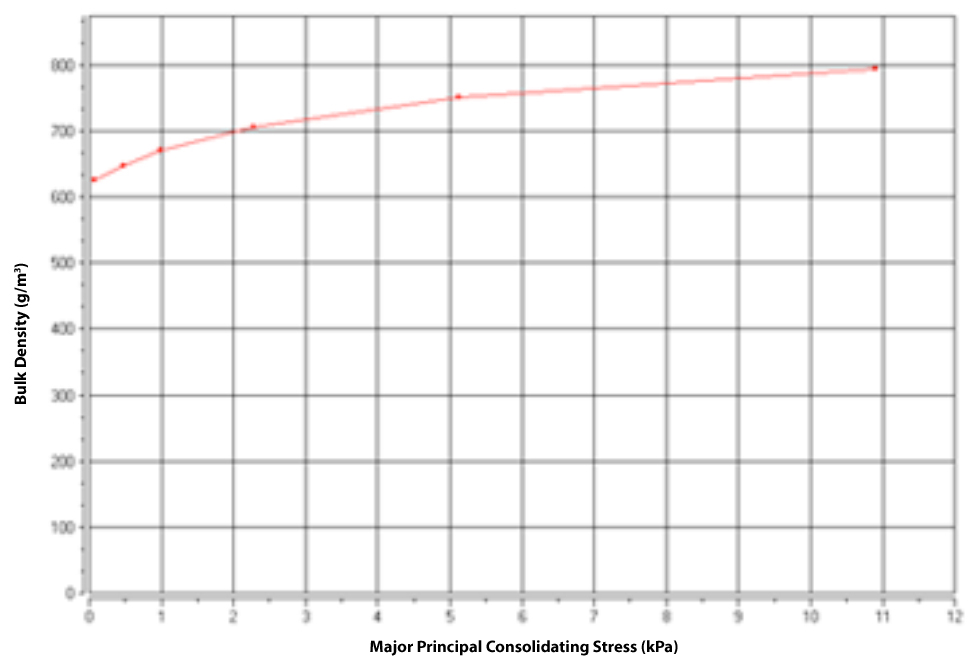
Figure 3: Bulk density graph of corn starch
Corn starch is a very cohesive powder at low consolidation stress levels (less than 1 kPa), cohesive at consolidation stress levels of 1 kPa to 6 kPa, and flows easily at stress levels high consolidation. This means that the cornstarch may have flow issues when the hopper empties. The critical arch dimension of 2.5 inches (63.1 mm) provides a conservative estimate to prevent arching, provided that the minimum outlet dimension of the hopper exceeds this value.
Is Bubble Tower Temperature Calibration in Corrosion Testing Really Necessary ?
What is the Best Way to Accelerate Moisture Uptake in a Weathering Test ?
Case study: Measuring the hardness and crispness of banana crisps
Verification, by the high voltage method, of the continuity of a coating applied to a cement-based substrate.
Case study: Measuring the tensile strength of lasagna
Where can I get my Brookfield viscometer repaired or calibrated?
I've never done weathering testing, but I'm interested. What's next ?


